kibana使用介绍
kibana服务配置很简单
vim /etc/kibana/kibana.yml
| Bash |
|---|
| server.port: 5601
server.host: "0.0.0.0"
elasticsearch.hosts: ["http://172.26.32.57:9200"]
elasticsearch.username: "kibana"
elasticsearch.password: "xxxxxxxx"
logging.silent: true
|
配置好后启动服务即可
| Bash |
|---|
| systemctl start kibana
systemctl enable kibana
|
接下来基本在页面操作http://172.26.32.57:5601
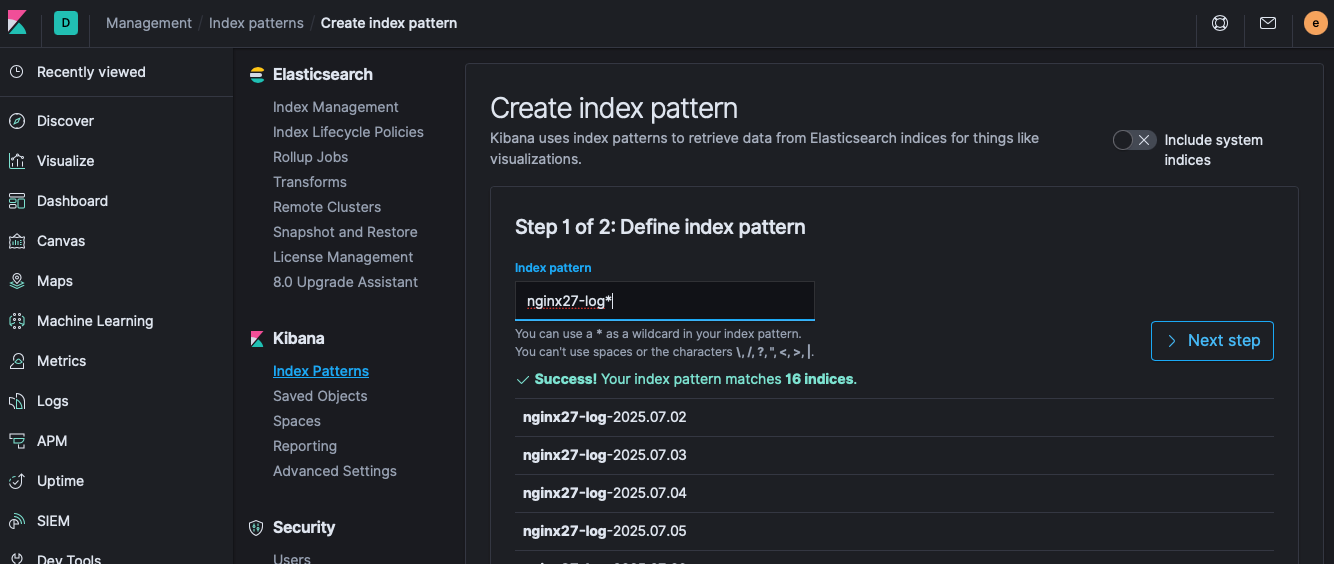
创建索引模式
ES收到日志后,在kibana页面创建索引模式,可以使用正则表达式匹配日志索引
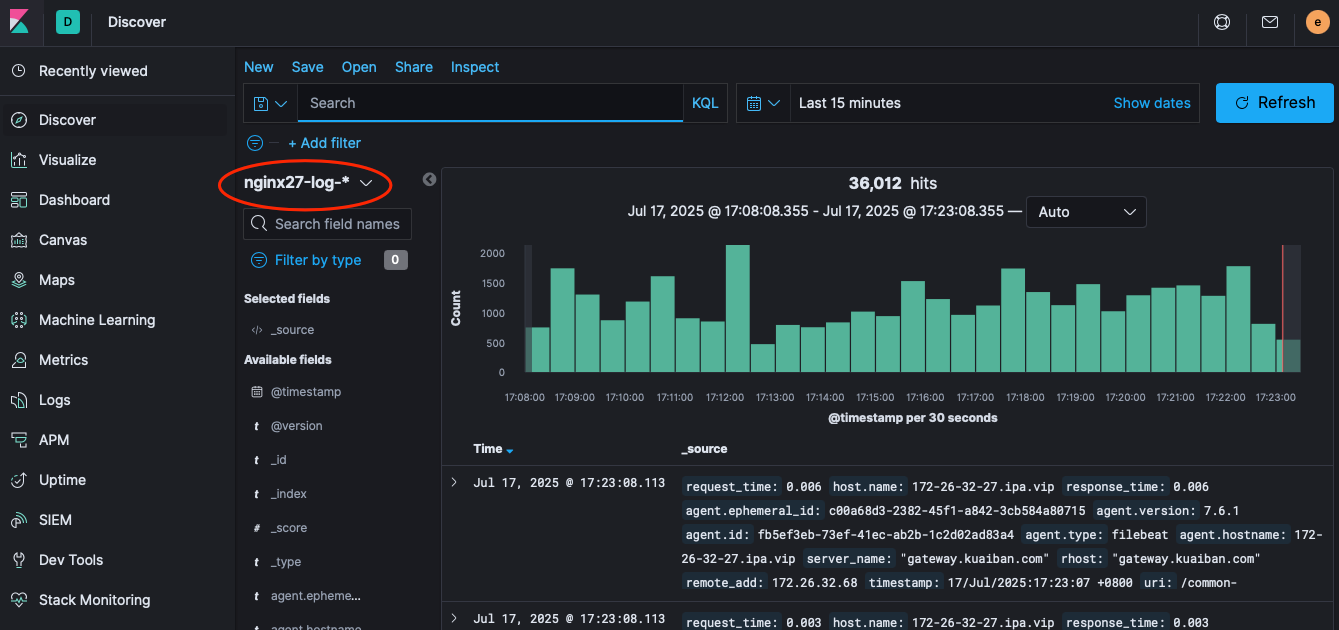
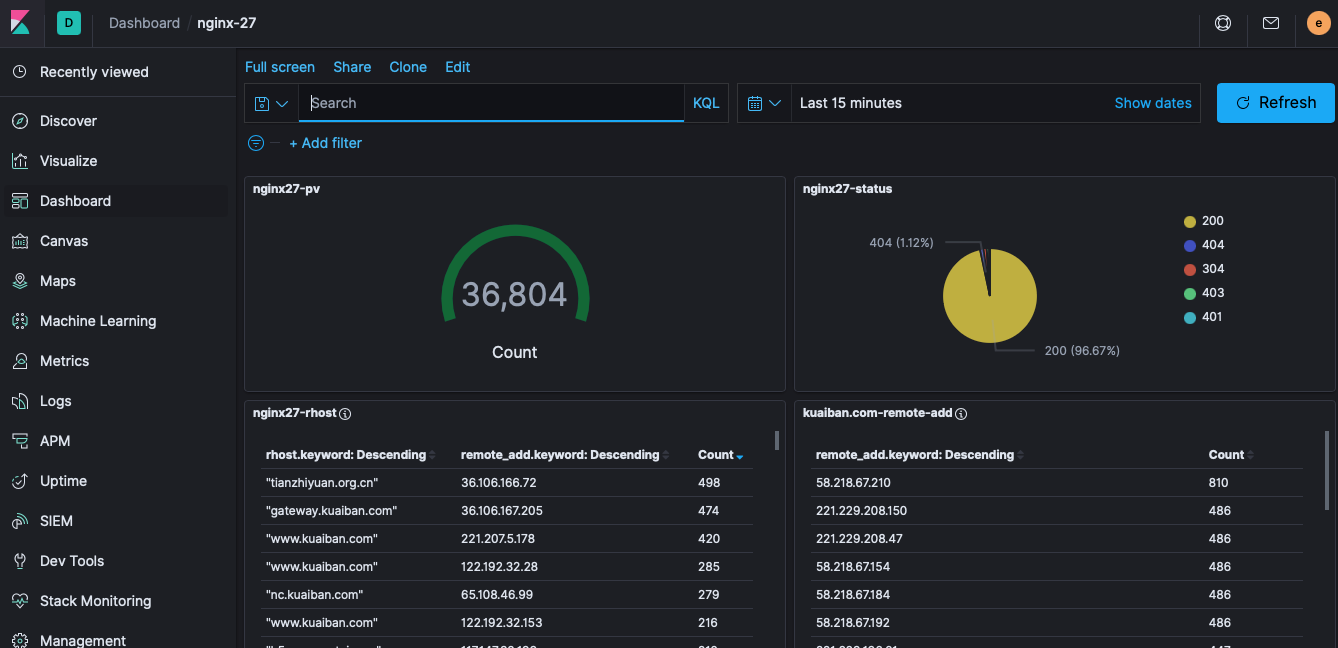
之后在Discover 可以看到创建的聚合索引,以此来搜索、分析日志
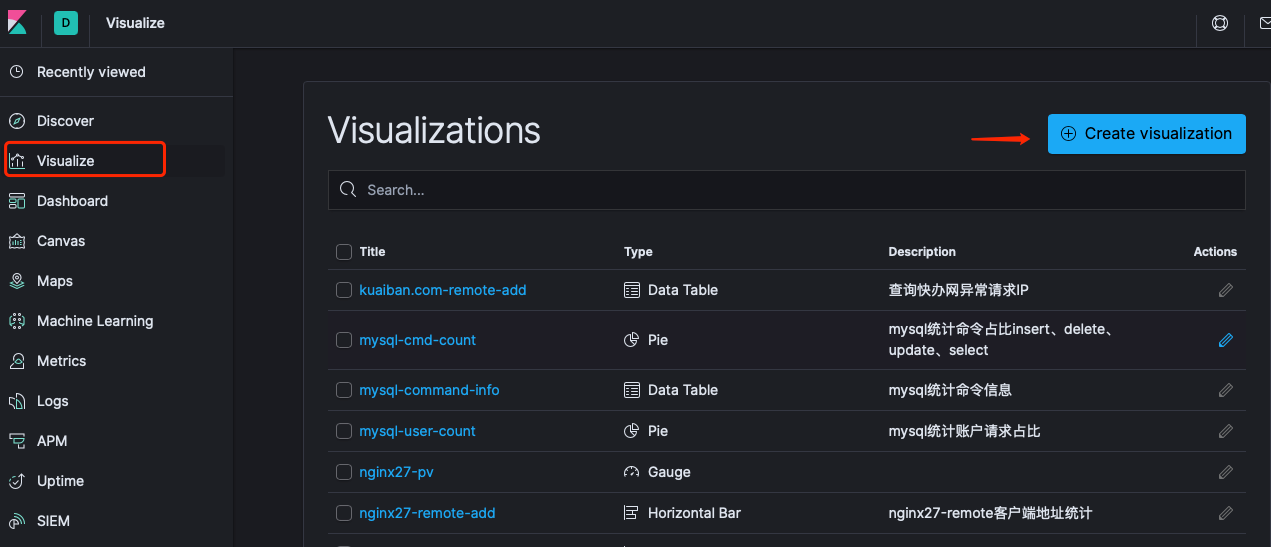
Visualize 创建可视化图表,用作日常分析查阅
Dashboard 可以将创建的可视化图表汇集成仪表盘展示
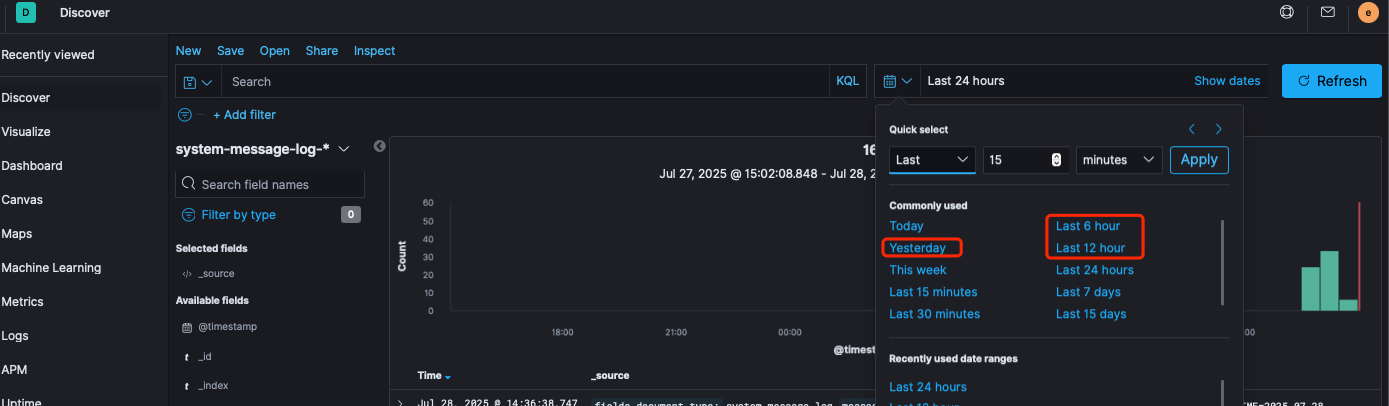
修改Quick select 中的日期
Management-kibana-Advanced Settings
Time filter quick ranges
| Bash |
|---|
| [
...
{
"from": "now-1d/d",
"to": "now-1d/d",
"display": "Yesterday"
},
{
"from": "now-6h",
"to": "now",
"display": "Last 6 hour"
},
{
"from": "now-12h",
"to": "now",
"display": "Last 12 hour"
},
{
"from": "now-15d",
"to": "now",
"display": "Last 15 days"
}
....
]
|
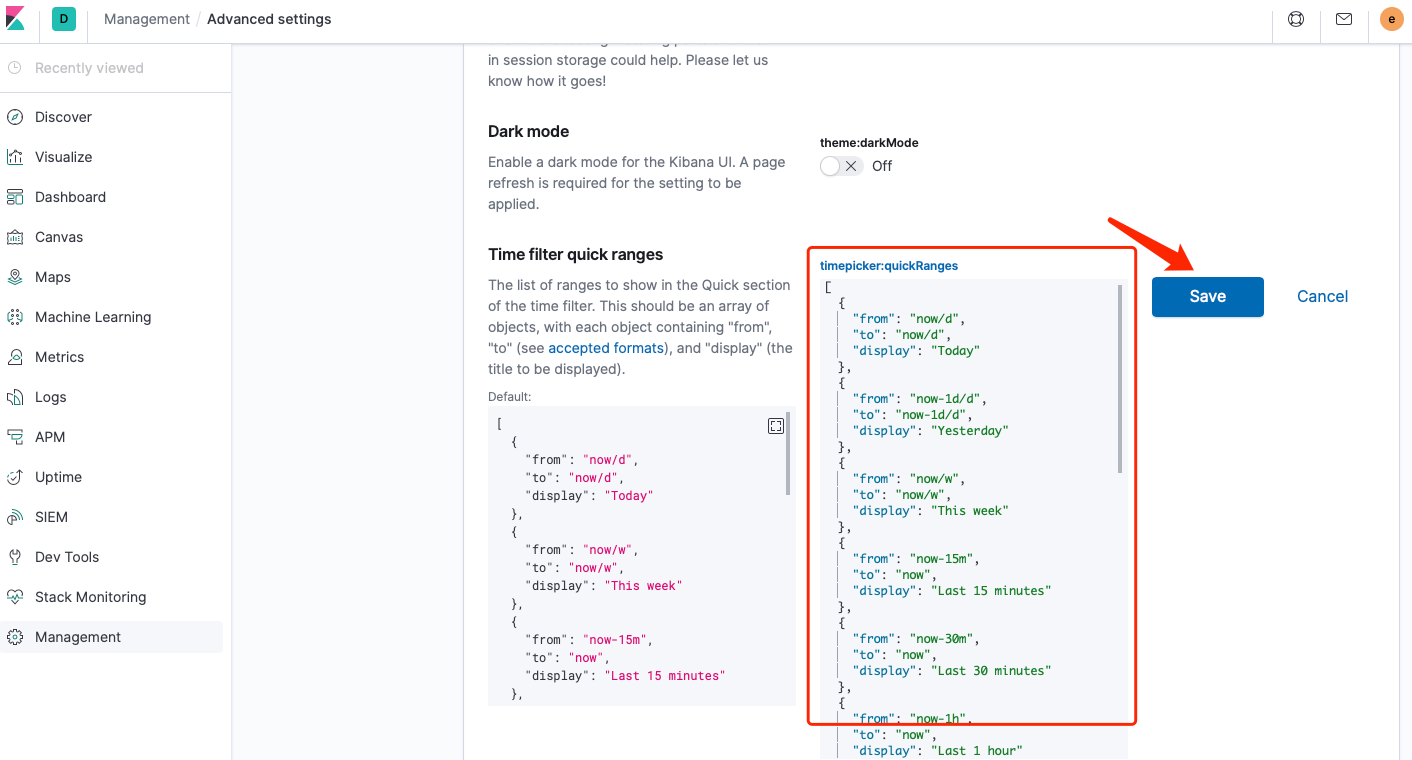
这个选项可以修改页面为黑暗模式

可以看到Discover的时间新增了